logana
A fast terminal log viewer for files of any size — including multi-GB logs. Built on SIMD-accelerated line indexing, search, and filtering. Auto-detects log formats, filters by pattern, regex, field value, or date range — bookmark lines, add annotations, and export your analysis.
What is it for
Log files are large and noisy. logana helps you cut through them — filter down to what matters, bookmark key lines, attach notes, and export your findings. Everything is saved between sessions, so you never lose your place. Filter sets can also be saved and reused across files: once you have filters for the key messages and components you care about, loading them on a new file gives you a focused view immediately.
The typical use cases are:
-
Incident investigation — narrow down a multi-gigabyte production log to the relevant window using date-range and pattern filters, mark the key lines, attach notes explaining what you found, and export your findings to Markdown or Jira.
-
Long-running process monitoring — stream a running process or Docker container, watch it in tail mode, and flip back to filter history without losing our place.
-
Recurring log review — save a filter set for a well-known log format (e.g. “show only ERRORs from the auth service”) and reuse it the next time you need it.
What makes it different
Log format detection
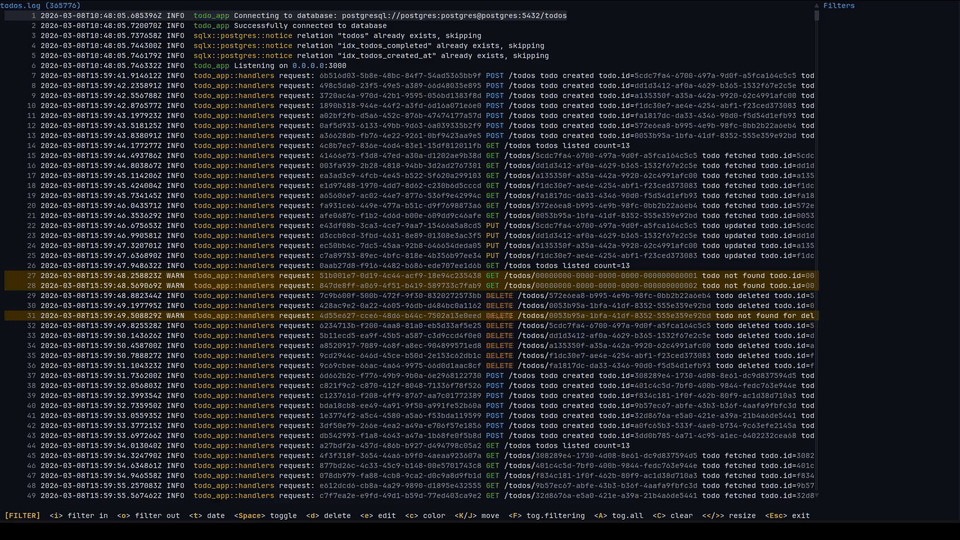
logana recognises common log formats automatically — JSON, syslog, journalctl, logfmt, logback, Spring Boot, Python logging, Apache access logs, DLT (AUTOSAR), and more — and shows each line broken into columns: timestamp, level, service name, message. You can hide columns you don’t care about and reorder the ones you do, per file.
Filtering
Include and exclude filters stack freely. Include filters narrow the view to matching lines; exclude filters hide lines on top of that. Both support plain text and regular expressions.
You can also filter by time: > Feb 21 01:00:00, 01:00:00 .. 02:00:00, >= 2024-02-22. Date filters work the same way regardless of which log format is open.
Filtering runs in the background — the UI stays responsive on large files, and changing a filter cancels the previous scan immediately.
Persistent sessions
Filters, scroll position, bookmarks, and notes are saved per file and restored automatically on next open. Filter sets can be exported to a file and loaded on the command line with --filters, so the same filters work across multiple log files. Combined with --tail, the last matching line is shown immediately after loading.
Notes and export
Bookmark individual lines with m. When you want to attach context, select a range with V (line selection) or v (character selection) and press c to write a note. :export produces a document with your notes and the relevant log lines ready to share.
Navigation
Feels like vim. Full motion support: j/k, gg/G, Ctrl+d/u, //? search, n/N between matches, w/b/e word motions, f/t character find, count prefixes on all motions. All keys are configurable.
Feature Overview
| Feature | Description |
|---|---|
| Auto-detected formats | JSON, syslog, journalctl, logfmt, DLT, logback/log4j2, Spring Boot, Python, loguru, Apache CLF, and more |
| Structured columns | Timestamp, level, service, message as separate columns; show/hide/reorder per file |
| Persistent sessions | Filters, scroll position, bookmarks, and notes restored on next open |
| Include/exclude filters | Plain text or regex; include and exclude stack freely |
| Date and time filters | Limit the view to a time window or comparison |
| Background filtering | Runs in the background; changing a filter cancels the previous scan immediately |
| Startup filters | --filters loads a filter set at launch; --tail jumps to the last match |
| Notes and export | Attach comments to lines; export to Markdown or Jira with :export |
| Visual line mode | Select a line range to bookmark, annotate, copy, or build a filter from |
| Visual character mode | Select within a line using vim motions to filter, search, or copy |
| Vim navigation | Full motions: j/k, gg/G, w/b/e, f/t, count prefixes, //? search |
| Multi-tab | Open multiple files, Docker streams, or DLT connections side-by-side |
| Docker | Attach to any running container with :docker |
| DLT | Stream from a DLT daemon with :dlt, or open binary .dlt files directly |
| Value coloring | HTTP methods, status codes, IP addresses, and UUIDs colored automatically; filter colors always take priority and multiple filter styles (fg + bg) compose |
| Configurable | All keys remappable; 19 bundled themes; custom themes and export templates |
Installation
Pre-built Binaries (Recommended)
Download from the Releases page, or use the install script:
Linux / macOS
curl -fsSL https://github.com/pauloremoli/logana/releases/latest/download/install.sh | sh
Windows (PowerShell)
irm https://github.com/pauloremoli/logana/releases/latest/download/install.ps1 | iex
Homebrew (macOS / Linux)
brew tap pauloremoli/logana
brew install logana
Cargo (crates.io)
cargo install logana
Cargo (from source)
cargo install --git https://github.com/pauloremoli/logana
Quick Start
Opening Logs
# Open a file
logana app.log

# Open a directory — each file opens in its own tab
logana /var/log/

# Pipe from stdin
journalctl -f | logana
tail -f app.log | logana

# Stream a Docker container
logana            # then type :docker

# Preload a saved filter set — filters are applied in a single pass during indexing
logana app.log --filters my-filters.json

# Add inline filters directly on the command line
logana app.log -i error -o debug
logana app.log -i "--field level=ERROR" -t "> 2024-02-21"

# Start at the end of the file with tail mode enabled
logana app.log --tail

# Combined: preload filters and jump to the last matching line immediately
logana app.log --filters my-filters.json --tail
First Steps
Once logana opens, you’ll see the log content with the detected format shown in the title bar.
Basic navigation:
j/k— scroll down / up one linegg/G— jump to first / last lineCtrl+d/Ctrl+u— half page down / upq— quit
Add your first filter:
- Press
iand type a pattern to show only matching lines - Press
oand type a pattern to hide matching lines - Press
fto open the filter manager and see all active filters
Search:
- Press
/and type a query to search forward - Press
n/Nto jump between matches
Commands:
- Press
:to open command mode - Type a command and press
Enter(Tab completes commands, flags, and paths)
Navigation
logana uses Vim-style keybindings for all navigation. All bindings are configurable — see Keybindings.
Scrolling
| Key | Action |
|---|---|
j / Down | Scroll down one line |
k / Up | Scroll up one line |
Ctrl+d | Half page down |
Ctrl+u | Half page up |
PageDown | Full page down |
PageUp | Full page up |
gg | Jump to first line |
G | Jump to last line |
Horizontal Scroll
When line wrap is off, long lines can be scrolled horizontally:
| Key | Action |
|---|---|
h / Left | Scroll left |
l / Right | Scroll right |
0 | Jump to start of line (reset horizontal scroll) |
$ | Jump to end of line |
Count Prefix
Prepend a number to most motion keys to repeat them:
5j      — scroll down 5 lines
10k     — scroll up 10 lines
3Ctrl+d — scroll down 3 half-pages
50G     — jump to line 50
3gg     — jump to line 3
The active count is shown in the status bar (e.g. [NORMAL] 5). Counts are capped at 999,999.
Go to Line
From command mode, type a bare line number to jump there:
:500    — jump to line 500
:1      — jump to the first line
If the target line is hidden by an active filter, logana jumps to the nearest visible line instead.
Marks
Mark important lines to jump back to them or include them in an export.
| Key | Action |
|---|---|
m | Mark / unmark the current line |
M | Toggle marks-only view (show only marked lines) |
Marked lines show a highlighted indicator in the gutter. Marks are per-session and not persisted across runs.
Visual Selection
| Key | Action |
|---|---|
V | Enter visual line mode — select whole lines for bulk mark / comment / yank / filter |
v | Enter visual char mode — move a cursor within the current line and select a text range |
See Visual Line Mode and Visual Character Mode for the full key reference.
Log Level Navigation
Jump directly between error and warning lines without scrolling:
| Key | Action |
|---|---|
e | Jump to next ERROR / FATAL line |
E | Jump to previous ERROR / FATAL line |
w | Jump to next WARN line |
W | Jump to previous WARN line |
Navigation wraps to the nearest visible line that matches the level. Positions are pre-indexed whenever the visible set changes, so each jump is O(log n) regardless of file size.
Line Wrap
Toggle line wrapping with :wrap or via the UI menu (u → w). When wrap is enabled, long lines flow onto multiple terminal rows and all viewport math accounts for the extra rows automatically.
Visual Line Mode
Press V in normal mode to enter visual line mode. The current line becomes the anchor.
| Key | Action |
|---|---|
j / k | Extend selection down / up |
c | Attach a comment to the selected lines |
m | Mark / unmark all selected lines (toggles group) |
y | Yank (copy) selected lines to system clipboard |
i | Open command bar pre-filled with filter <first line> |
o | Open command bar pre-filled with exclude <first line> |
/ | Open search bar pre-filled with the first selected line |
Esc | Cancel |
Selected lines are highlighted in the log panel.
Visual Character Mode
Press v in normal mode to enter character-level visual mode. The cursor is placed on the current line — at the start of the active search match if one exists, otherwise at column 0. Move the cursor freely with vim motions before anchoring a selection.
Cursor motions
| Key | Action |
|---|---|
h / l / Left / Right | Move left / right one character |
w / b / e | Word start forward / backward / word end |
W / B / E | WORD (whitespace-delimited) variants |
0 | Move to start of line |
^ | Move to first non-blank character |
$ | Move to end of line |
f<c> | Find next occurrence of character c |
F<c> | Find previous occurrence of character c |
t<c> | Move to one before next c |
T<c> | Move to one after previous c |
; | Repeat last f/F/t/T motion |
, | Repeat last motion in reverse |
Anchoring and actions
Press v again to anchor the selection at the current cursor position. Any subsequent cursor motion extends the selection. Without an anchor, actions operate on the single character under the cursor.
| Key | Action |
|---|---|
v | Anchor selection at cursor |
i | Open command bar pre-filled with filter <selected> |
o | Open command bar pre-filled with exclude <selected> |
/ | Open search bar pre-filled with selected text |
y | Yank (copy) selection to system clipboard |
Esc | Cancel |
The selected character range is highlighted with a reversed colour in the log panel. When a f/F/t/T motion is pending (waiting for the target character), the mode bar shows pending — type a character.
Filtering
Filters are the primary way to narrow the log view. They are layered: include patterns narrow the view, and exclude patterns hide matching lines on top of whatever include filters already selected.
Quick Keys
| Key | Action |
|---|---|
i | Add include filter (show only matching lines) |
o | Add exclude filter (hide matching lines) |
f | Open filter manager |
F | Toggle all filtering on/off |
How Filters Work
Include filters: If any include filter is enabled, only lines matching at least one include filter are shown.
Exclude filters: Any line matching an enabled exclude filter is hidden, regardless of include filters.
No filters: All lines are shown.
Both filter types support:
- Text search — fast multi-pattern matching
- Regular expressions — full regex syntax, opt-in with
--regex/-r
Filter Persistence
Filters are saved to SQLite and automatically restored the next time you open the same file. When you reopen a file, logana detects whether the file has changed (via hash) and prompts you to restore the previous session.
Filter Manager
Press f to open the filter manager popup, which lists all active filters.
| Key | Action |
|---|---|
j / k | Navigate filters |
Space | Toggle selected filter on/off |
e | Edit selected filter’s pattern |
d | Delete selected filter |
c | Set highlight color for selected filter |
t | Add a date/time range filter |
J / K | Move filter down / up (order affects priority) |
A | Toggle all filters on/off |
C | Clear all filters |
Esc | Close filter manager |
Filter Colors
Each filter can have an optional highlight color. When a filter matches part of a line, that part is colored using the filter’s configured color. Colors are set per-filter with c in the filter manager, or via the :set-color command.
:set-color --fg red
:set-color --fg "#FF5555" --bg "#282A36"
Color values accept:
- Named colors:
black,red,green,yellow,blue,magenta,cyan,white,gray,darkgray,lightred,lightgreen,lightyellow,lightblue,lightmagenta,lightcyan - Hex:
"#RRGGBB"
Style composition
When multiple filters overlap on the same text segment, their fg and bg attributes are composed independently — the highest-priority filter that has fg set contributes the foreground color, and the highest-priority filter that has bg set contributes the background color. So a level filter that sets --fg yellow and a text filter that sets --bg darkgray on the same word will both apply without one canceling the other.
Color priority
Filter colors take priority over automatic value colors (HTTP methods, status codes, IPs, UUIDs) and log-level colors. Value colors are applied only to spans that are not already covered by a filter — they can still appear alongside filter colors on the same line, just not on the same character span. Log-level colors are the lowest-priority fallback and apply only to text that carries no explicit color from any other source.
Save and Load Filters
Export the current filter set to a JSON file, and reload it later:
:save-filters my-filters.json
:load-filters my-filters.json
This is useful for sharing filter sets across machines or between log files with similar structure.
Inline Filters at Startup
Add filters directly on the command line without creating a JSON file first:
| Flag | Short | Purpose |
|---|---|---|
--include <args> | -i | Add include filter |
--exclude <args> | -o | Add exclude filter |
--timestamp <args> | -t | Add date/time range filter |
The argument string passed to each flag accepts exactly the same options as the corresponding TUI command (:filter, :exclude, :date-filter):
# Simple pattern
logana app.log -i error -o debug

# Field-scoped filter
logana app.log -i "--field level=ERROR"

# Include filter with highlight color (flags before pattern)
logana app.log -i "--bg red error"

# Date range filter
logana app.log -t "> 2024-02-21"

# Combined
logana app.log -i error -o debug -t "01:00 .. 02:00"
All flags can be repeated. Inline filters are applied after any --filters file. Invalid argument strings are rejected before the TUI opens.
Preloading Filters at Startup
Pass --filters (or -f) on the command line to apply a saved filter set before the TUI opens:
logana app.log --filters my-filters.json
The filters are evaluated in a single pass during file indexing, so the filtered view is ready as soon as loading completes — no separate computation step. The same filters remain active for interactive use once the TUI is open (you can add, remove, or edit them normally).
Combined with --tail, the last matching line is shown immediately after loading:
logana app.log --filters errors.json --tail
Tip: Save your most-used filter sets with
:save-filtersonce, then reuse them from the command line.
Sections
- Text Filters — include/exclude patterns, regex syntax
- Date & Time Filters — timestamp-based range and comparison filters
- Field Filters — match against specific parsed fields (level, message, component, …)
Text Filters
Text filters match against the raw content of each log line.
Adding Filters
From normal mode:
- Press
ito add an include filter (opens command mode pre-filled withfilter) - Press
oto add an exclude filter (opens command mode pre-filled withexclude)
From command mode:
:filter <pattern>       # show only lines matching pattern
:exclude <pattern>      # hide lines matching pattern
Text Search
The default mode. Fast multi-pattern scanning. Case-sensitive. Multi-word patterns work without quotes.
:filter ERROR
:filter connection refused
:filter 500 Internal Server Error
:filter database connection pool exhausted
Regex Filters
Opt in with --regex / -r. Supports full regex syntax. Words after -r are joined, so spaces in the pattern do not need quoting.
:filter -r (ERROR|WARN)                      # errors and warnings together
:filter -r (timeout|connection refused)      # any connectivity failure
:filter -r authentication failed.*user       # auth failures with user context
:filter -r response time: [5-9]\d{3}ms      # slow responses over 5 seconds
Flag ordering: Options (
-r,--fg,--bg,-l,--field) must appear before the pattern. Everything after the first pattern word is part of the pattern.:filter --fg red -r timeout.*retry # correct :filter timeout.*retry --fg red # wrong — "--fg" becomes part of the pattern
Multiple Filters
You can add as many filters as you like. They combine as follows:
- Include filters — a line must match at least one enabled include filter to be shown (if any exist).
- Exclude filters — a line matching any enabled exclude filter is hidden.
Exclude takes priority: a line that satisfies an include filter but also matches an exclude filter is hidden.
Toggling Filters
- In the filter manager (
f), pressSpaceto enable/disable individual filters. - Press
Fin normal mode to toggle all filtering on/off instantly (useful for comparing filtered vs. unfiltered view). - Press
Ain the filter manager to enable/disable all filters at once.
Highlight Colors
Each include filter highlights its matching byte spans in the log line. The color is configurable per filter. When no color is set, logana uses a default highlight style from the active theme.
To set a color for the currently selected filter in the filter manager, press c, then use :set-color:
:set-color --fg yellow
:set-color --fg "#FF5555" --bg "#44475A"
By default, only the matched portion of the line is colored. To highlight the entire line instead, pass -l when adding the filter:
:filter -l ERROR            # highlight the full line for every ERROR match
:filter --fg red -l ERROR   # full-line red highlight
The -l flag can also be applied later with :set-color -l from the filter manager.
When multiple filters overlap on the same span, their fg and bg are composed: one filter can contribute the foreground color while another contributes the background. Automatic value colors (HTTP methods, status codes, IPs, UUIDs) apply only to spans not already colored by a filter, and log-level colors are the lowest-priority fallback.
Editing Filters
Editing a filter’s pattern or color from the filter manager (e to edit pattern, c to change color) updates it in-place. The filter keeps its current position in the list — order is never changed by an edit.
Date & Time Filters
Date filters narrow the visible lines by their parsed timestamp. They work as a post-processing step after text filters — only lines already passing text filters are checked against date filters.
Adding a Date Filter
From the filter manager (f → t): opens command mode pre-filled with date-filter .
From command mode:
:date-filter <expression>
Expression Syntax
Equals (no operator)
Omitting an operator matches the full period implied by the input’s granularity.
| Input | Matches |
|---|---|
09:00 | the whole minute 09:00:00 – 09:00:59 |
09:00:30 | the exact second 09:00:30 |
Feb 21 | all of Feb 21 (00:00:00 – 23:59:59) |
Feb/21 | same — / is accepted as month/day separator |
02/21 | same — numeric month/day |
02-21 | same — numeric month-day |
02/21/2024 | all of Feb 21 2024 |
02-21-2024 | same with dash separators |
2024-02-21 | all of Feb 21 2024 |
2024-02-21 10:15 | the whole minute 10:15:00 – 10:15:59 |
2024-02-21 10:15:30 | the exact second |
:date-filter Feb/21
:date-filter 02/21
:date-filter 02-21
:date-filter 09:00
Range (..)
Both bounds are inclusive. Spaces around .. are optional.
The upper bound is expanded to the end of its granularity period: a day-level upper bound covers up to 23:59:59.999999, a minute-level upper bound covers up to :59.999999, and a second-level upper bound is exact.
# time-only (compares seconds since midnight)
:date-filter 09:00 .. 17:00       # 09:00:00 – 17:00:59
:date-filter 09:00..17:00         # same, no spaces required
:date-filter 09:00:00 .. 17:00:00 # exact seconds

# BSD month names
:date-filter Feb 21 .. Feb 22     # Feb 21 00:00:00 – Feb 22 23:59:59
:date-filter Feb/21 .. Feb/22

# numeric month/day
:date-filter 02/21 .. 02/22       # Feb 21 00:00:00 – Feb 22 23:59:59
:date-filter 02-21 .. 02-22
:date-filter 03-21..03-25         # no spaces

# ISO dates
:date-filter 2024-02-21 .. 2024-02-22

# full datetimes (second-exact bounds, no expansion)
:date-filter 2024-02-21T10:00:00 .. 2024-02-21T11:30:00
:date-filter 2024-02-21 10:00:00 .. 2024-02-21 11:30:00
Comparison operators
:date-filter > 2024-02-21T10:00:00    # after
:date-filter >= Feb 21 10:00:00       # from (inclusive)
:date-filter < 02/22                  # before Feb 22
:date-filter <= Feb 22                # up to and including
Supported operators: >, >=, <, <=
Accepted Date/Time Formats
Date bounds
| Format | Example | Year |
|---|---|---|
| BSD month name + day | Feb 21, Feb/21 | none (month/day only) |
| Numeric MM/DD | 02/21 | none |
| Numeric MM-DD | 02-21 | none |
| Numeric MM/DD/YYYY | 02/21/2024 | included |
| Numeric MM-DD-YYYY | 02-21-2024 | included |
| ISO date | 2024-02-21 | included |
Time bounds
| Format | Example | Granularity |
|---|---|---|
HH:MM | 09:00 | minute |
HH:MM:SS | 09:00:30 | second |
Combined datetime bounds
Any date format above followed by a space and a time:
Feb/21 09:00
02/21 09:00:30
02-21-2024 10:15
2024-02-21T10:15:30
2024-02-21 10:15:30
ISO 8601 T separator and a plain space are both accepted.
Rules and Limitations
- Inclusive bounds:
..ranges include both endpoints (>=lower AND<=upper). - No midnight wraparound:
23:00 .. 01:00is invalid. Use two comparison filters instead. - Mixed-mode ranges are rejected: both sides of a
..must use the same format (both time-only or both date). - Multiple date filters are OR-ed: a line passes if it satisfies any enabled date filter.
- Lines without a timestamp pass through: continuation lines, stack traces, and multi-line messages are never hidden by date filters.
- Requires a detected format parser: if logana cannot detect the log format, date filters return an error. This means plain-text logs without timestamps cannot be date-filtered.
Display
Date filters appear in the filter manager and sidebar as Date: <expression>, not as raw @date: patterns.
How It Works
Date filters are stored as regular FilterDef entries in the database with an @date: prefix in the pattern field (e.g. @date:01:00:00 .. 02:00:00). They are excluded from the text-filter pipeline and applied separately in refresh_visible() after text filters run, via retain() on visible_indices.
Timestamps are normalized to a canonical YYYY-MM-DD HH:MM:SS.ffffff string before comparison, so all supported log format timestamps (ISO 8601, BSD, logback datetime, CLF, journalctl, Apache error, etc.) are comparable regardless of their original format.
Field Filters
Field filters let you narrow the log view by the value of a specific parsed field rather than matching against the raw line text. This is useful when you want to, for example, show only error-level lines without accidentally matching the word “error” in a message body.
Syntax
:filter --field <key>=<value>
:exclude --field <key>=<value>
The --field flag tells logana to treat the pattern as a key=value pair. The value is matched as a substring of the named field.
:filter --field level=error         # show only lines where level contains "error"
:filter --field component=auth      # show only lines from the auth component
:exclude --field level=debug        # hide all debug-level lines
Field Name Aliases
The following short aliases are recognised regardless of how the field is named in the raw log:
| Alias(es) | Field |
|---|---|
level, lvl | log level |
timestamp, ts, time | timestamp |
target | logger / target name |
message, msg | log message body |
| anything else | looked up by exact key in extra fields |
For example, :filter --field lvl=warn and :filter --field level=warn are equivalent.
Combining Field Filters
Multiple include field filters — all must match (AND logic):
:filter --field level=error
:filter --field component=auth
# only lines where level contains "error" AND component contains "auth"
Exclude field filters — hide any line where the field matches:
:exclude --field level=debug
Mixed include and exclude — exclude takes priority. A line that satisfies an include filter but also matches an exclude filter is hidden.
Pass-Through Behaviour
Lines that cannot be parsed (e.g. plain-text lines in an otherwise structured file) are always shown — they are not hidden by field filters. The same applies when the named field is absent from an otherwise parseable line.
This matches the behaviour of date filters for lines without timestamps.
Sidebar Display
Field filters appear in the filter manager sidebar with a [field] tag:
[x] In: level=error [field]
[x] Out: level=debug [field]
Requires a Detected Format
Field filters only have an effect when logana has detected a structured log format (JSON, logfmt, syslog, etc.). On plain-text files with no detected format, all lines pass through field filters unchanged.
See Log Formats for the list of supported formats.
Search
Search operates on visible lines only — it respects active filters and only scans lines that are currently shown.
Keybindings
| Key | Action |
|---|---|
/ | Search forward |
? | Search backward |
n | Jump to next match |
N | Jump to previous match |
Usage
Press / or ? to open the search bar at the bottom of the screen. Type your query and press Enter. logana highlights all matches on visible lines and scrolls to the first match.
nwraps around to the first match after the last line.Nwraps around to the last match before the first line.
Pattern Syntax
Search uses full regex syntax. Examples:
/NullPointerException              plain text
/user 42 .* failed                 regex — activity for a specific user
/POST /api/orders.* 5\d\d          regex — failed order requests
/^2024-06-15T14                    lines from a specific hour
Case Sensitivity
By default, search is case-sensitive. Case sensitivity can be toggled programmatically via the Search API (no UI toggle yet — the default behavior is case-sensitive matching).
Match Highlighting
Matched byte spans are highlighted with the search style (distinct from filter highlight colors). Search highlights take priority over filter highlights — if a search match overlaps a filter-colored span, the search color wins.
The current match (the one n/N is positioned on) is rendered with a distinct highlight color to distinguish it from other occurrences on screen.
When wrap is disabled, navigating to a match with n or N also adjusts the horizontal scroll to center the matched span in the viewport.
Search vs. Filters
| Search | Filter | |
|---|---|---|
| Persisted | No | Yes |
| Affects visible lines | No | Yes |
| Highlighted | Yes | Yes |
| Navigation (n/N) | Yes | No |
| Regex support | Yes | Yes |
Use filters to permanently narrow the view. Use search to navigate through specific patterns within the already-filtered view.
Structured Fields
When logana detects a structured log format (JSON, logfmt, syslog, tracing-subscriber, etc.), it parses each line into named columns: timestamp, level, target, span, and message, plus any extra fields specific to the format.
Columns
| Column | Description |
|---|---|
timestamp | Parsed log timestamp |
level | Normalized log level (TRACE, DEBUG, INFO, WARN, ERROR, FATAL) |
target | Logger name, module path, or source identifier |
span | Tracing span context (name + fields), if present |
message | The log message body |
| extra fields | Format-specific extras (e.g. pid, thread, hostname, request_id) |
Showing and Hiding Columns
Use :select-fields to open an interactive column picker:
j/k— navigateSpace— toggle column on/offJ/K— reorder columnsa— enable alln— disable allEnter— applyEsc— cancel
Or use commands directly:
:fields timestamp level message       # show only these columns, in this order
:hide-field span                      # hide a single column
:show-field span                      # show a previously hidden column
:show-all-fields                      # reset to default display
Field Key Display
Extra fields and span fields carry both a key and a value. By default logana shows only the values to keep lines compact. Use :show-keys to include the key names:
:show-keys     # request_id=abc123  status=200  request: method=GET uri=/api/users
:hide-keys     # abc123  200  request: GET /api/users  (default)
This applies to all structured formats — JSON extra fields, logfmt pairs, syslog structured data, span fields, and any other key-value extras that don’t map to a canonical column (timestamp, level, target, message). This setting is persisted per file in the session database.
Span Fields
Span context is parsed from formats that carry it (tracing-subscriber JSON, tracing-subscriber fmt text, and others). The span column shows the span name followed by its fields:
request: GET /api/users        # hide-keys (default)
request: method=GET uri=/api/users   # show-keys
Span sub-fields can also be selected as individual columns:
:fields timestamp level span.method span.uri message
Value Coloring
Even within structured columns, known value patterns are colored automatically:
- HTTP methods — GET (green), POST (yellow), PUT (blue), DELETE (red), PATCH (magenta)
- HTTP status codes — 2xx (green), 3xx (cyan), 4xx (yellow), 5xx (red)
- IP addresses — IPv4 and IPv6
- UUIDs
Configure which categories are colored via :value-colors.
Tab Completion for Field Names
The :fields command and :hide-field / :show-field commands complete against the field names discovered from the first 200 visible log lines, so you don’t need to remember exact field names.
Annotations & Export
Annotations let you attach multiline comments to log lines and export an analysis report. This is useful for incident investigations, code reviews, and sharing findings with your team.
Visual Selection
Use Visual Line Mode (V) to select whole lines, or Visual Character Mode (v) to select text within a line. From either mode you can attach a comment, mark lines, copy to clipboard, or build a filter.
Adding a Comment
With lines selected in visual mode, press c to open the comment editor:
- Type your multiline comment
Enter— insert new lineBackspace— delete character / merge linesLeft/Right— move cursor (wraps between lines)Up/Down— move between rowsCtrl+s— save the commentEsc— cancel without saving
After saving, annotated lines show a ◆ marker in the gutter.
Editing and Deleting Comments
In normal mode, move to an annotated line and:
| Key | Action |
|---|---|
r | Open the comment editor pre-filled with the existing text |
d | Delete the comment on the current line |
Inside the editor, Ctrl+D also deletes the comment.
In normal mode, c opens the comment editor for the current line directly (without entering visual mode first).
Press C in normal mode to clear all marks and comments for the current tab.
Marks
Press m to mark the current line. Marked lines are included in exports even without a comment attached. Press M to toggle a marks-only view.
Exporting
Export all annotations and marked lines to a file:
:export report.md                    # Markdown (default)
:export report.md -t jira            # Jira wiki markup
:export report.md -t <template>      # custom template
The export includes:
- A header with the filename and export date
- Each comment group with the commented log lines and the comment text
- Any standalone marked lines (without a comment) grouped consecutively
Export Window
When the selected template’s footer section contains any {{placeholder}} variables, :export opens a window before writing the file so you can fill in those sections interactively. Both bundled templates (markdown and jira) include {{conclusion}} and {{next_steps}} by default, and any custom placeholder name works the same way.
| Key | Action |
|---|---|
Tab / Shift+Tab | Switch between Conclusion and Next Steps |
Enter | Insert a new line |
Backspace | Delete character before cursor / merge lines |
Delete | Delete character at cursor / merge next line |
Left / Right | Move cursor (wraps between lines) |
Up / Down | Move between rows |
Ctrl+S | Write the file |
Esc | Cancel without writing |
The active field scrolls to keep the cursor visible when content exceeds the window height.
Export Templates
Two templates are bundled: markdown and jira. Custom templates can be placed in ~/.config/logana/templates/.
Template syntax:
{{#header}}
# Analysis: {{filename}}
Date: {{date}}
{{/header}}

{{#comment_group}}
{{lines}}
{{commentary}}
{{/comment_group}}
Available placeholders:
| Placeholder | Content |
|---|---|
{{filename}} | Source file name |
{{date}} | Export date |
{{lines}} | The annotated log lines, each prefixed with its 1-based line number |
{{commentary}} | The comment text |
{{conclusion}} | Conclusion text (footer) |
{{next_steps}} | Next steps text (footer) |
Any {{custom_name}} placeholder you add to the footer section becomes an editable field in the export window. Use underscores for multi-word names ({{root_cause}} → “Root Cause”).
Template sections: header (rendered once), comment_group (rendered per annotation/mark group), footer (optional, rendered once at the end).
User templates in ~/.config/logana/templates/ shadow bundled ones by name. Tab completion lists all available templates.
Docker Logs
logana can stream logs from any running Docker container directly in the terminal, with the same filtering, search, and annotation features available for file-based logs.
Opening a Container Stream
From normal mode, type:
:docker
A picker lists all running containers. Navigate with j / k and press Enter to attach. The stream opens in a new tab.
| Key | Action |
|---|---|
j / k | Navigate container list |
Enter | Attach to selected container |
Esc | Cancel |
Auto-Reconnect
If the connection to a Docker container fails or drops, logana retries automatically with increasing backoff. The tab name shows [RETRY #N] while reconnecting.
Session Persistence
Docker tabs are persisted across sessions. When you reopen logana, it automatically re-attaches to any Docker containers that were open in the previous session, by container name. The source identifier stored in the session database is docker:<container-name>.
Tail Mode
Docker tabs benefit from tail mode — when enabled, the view auto-scrolls to show new log entries as they arrive:
:tail # toggle tail mode on/off
When tail mode is active, [TAIL] appears in the log panel title.
Filtering and Annotations
All filter, search, and annotation features work identically for Docker streams. Filters are persisted per container name, just like file-based logs.
Piping Docker Compose Logs
You can also pipe docker compose logs directly into logana:
docker compose logs -f 2>&1 | logana
The 2>&1 redirect is important — without it, Docker’s warnings (e.g. unset variable notices) go straight to the terminal and corrupt the TUI display. Merging stderr into stdout ensures everything flows through the pipe and appears as log entries inside logana, where you can filter them as needed.
To suppress the warnings entirely instead:
docker compose logs -f 2>/dev/null | logana
Requirements
- Docker must be installed and accessible via
dockerinPATH. - The
docker pscommand must return running containers. - Logs are streamed via
docker logs -f <container-id>, with stdout and stderr merged.
DLT Streaming
logana can connect to a running DLT daemon over TCP and stream log messages in real time, with the same filtering, search, and annotation features available for file-based logs.
Opening a DLT Stream
From normal mode, type:
:dlt
A picker lists configured DLT devices. Navigate with j / k and press Enter to connect. The stream opens in a new tab.
| Key | Action |
|---|---|
j / k | Navigate device list |
Enter | Connect to selected device |
a | Add a new device inline |
Esc | Cancel |
Configuring Devices
DLT devices can be configured in ~/.config/logana/config.json:
{
  "dlt_devices": [
    { "name": "local", "host": "127.0.0.1", "port": 3490 },
    { "name": "target-ecu", "host": "192.168.1.100", "port": 3490 }
  ]
}
The default port is 3490. Devices can also be added from the selection panel by pressing a.
Opening DLT Binary Files
DLT binary files (.dlt) are opened like any other log file:
logana trace.dlt
Three binary layouts are detected automatically: storage format (with DLT\x01 magic), wire format (concatenated messages without storage headers), and simplified format.
Auto-Reconnect
If the connection to the DLT daemon fails or drops, logana retries automatically with increasing backoff (0s, 2s, 5s, 10s). The tab name shows [RETRY #N] while reconnecting, and the error details appear in the status bar. Once the connection is re-established, streaming resumes normally.
Session-restored DLT tabs also reconnect automatically without blocking the UI.
Session Persistence
DLT tabs are persisted across sessions. When you reopen logana, it reconnects to any DLT daemons that were open in the previous session. The source identifier stored in the session database is dlt://host:port.
Tail Mode
DLT streams benefit from tail mode — when enabled, the view auto-scrolls to show new log entries as they arrive:
:tail
Fields
DLT messages expose the following fields for filtering and display:
| Field | Description |
|---|---|
timestamp | Wall-clock time (streaming) or relative time (file) |
hw_ts | Hardware timestamp counter |
mcnt | Message counter (0-255) |
ecu | ECU identifier |
apid | Application ID (shown as target) |
ctid | Context ID |
type | Message type (log, trace, network, control) |
subtype | Sub-type (fatal, error, warn, info, debug, verbose) |
mode | Verbose or non-verbose |
OTel Collector
logana can receive OpenTelemetry logs in real time over gRPC or HTTP/JSON, turning it into a live OTel log viewer with the same filtering, search, and annotation features available for file-based logs.
Starting a Receiver
From normal mode, type:
:otel              # gRPC on port 4317 (default — matches OTel SDK defaults)
:otel --http       # HTTP/JSON on port 4318
:otel 4317         # gRPC on a custom port
:otel --http 4318  # HTTP/JSON on a custom port
The receiver opens in a new tab and listens for incoming log export requests. Logs appear as they arrive.
Transport Modes
| Mode | Command | Default Port | Protocol |
|---|---|---|---|
| gRPC | :otel | 4317 | OTLP/gRPC (protobuf) |
| HTTP/JSON | :otel --http | 4318 | OTLP/HTTP (JSON or protobuf) |
gRPC (default)
The gRPC receiver accepts ExportLogsServiceRequest messages on port 4317. This matches the default export protocol used by most OTel SDKs.
The server runs in plaintext mode (no TLS). Configure your SDK to use an insecure connection:
# Environment variable (works for all OTel SDKs)
OTEL_EXPORTER_OTLP_INSECURE=true

# Or use the http:// scheme in the endpoint URL
OTEL_EXPORTER_OTLP_ENDPOINT=http://localhost:4317
HTTP/JSON
The HTTP receiver accepts POST /v1/logs with application/json or application/x-protobuf content types, and handles gzip-compressed request bodies.
Auto-Reconnect
If the receiver encounters an error on startup (e.g. port already in use), logana reports the error in the tab. Fix the conflict and reopen with :otel again.
Session Persistence
OTel collector tabs are persisted across sessions. When you reopen logana, it automatically restarts the receiver on the same port. The source identifier stored in the session database is otlp-grpc://<port> (gRPC) or otlp://<port> (HTTP).
Parsed Fields
Logs received over OTLP are parsed with the same OTel parser used for file-based OTLP logs:
| Field | Source |
|---|---|
| Timestamp | timeUnixNano |
| Level | severityNumber / severityText |
| Message | body.stringValue |
| Target | service.name, code.namespace, logger (from resource or log attributes) |
| Extra fields | All other resource attributes and log attributes |
Multi-Tab
logana supports multiple tabs, each showing an independent log file, directory, stdin stream, or Docker container.
Tab Keybindings
| Key | Action |
|---|---|
Tab | Switch to next tab |
Shift+Tab | Switch to previous tab |
Ctrl+t | Open a new (empty) tab |
Ctrl+w | Close the current tab |
Opening Files in Tabs
From the command line, each file argument opens in its own tab (not yet supported for multiple positional args, but directory expansion creates one tab per file):
logana /var/log/ # each file in the directory gets its own tab
From within logana, use the :open command:
:open app.log            # opens in the current tab
:open /var/log/          # opens each file in a new tab (directory)
Tab State
Each tab maintains completely independent state:
- Scroll position and viewport
- Active filters (with their colors and enabled/disabled states)
- Search query
- Marks and annotations
- Detected log format
- Field layout (visible columns and order)
- Display flags (wrap, sidebar, tail mode, show-keys)
Session Restore
When you close logana and reopen it without arguments, it prompts to restore the previous session — reopening all tabs that were open at exit, with their per-tab state restored. Docker tabs are re-attached by container name.
Merged View
:merge opens a source-selection popup where you can choose any combination of open tabs. Confirming creates a new merged(N) tab that interleaves all selected sources sorted by timestamp — no data is copied.
:merge # open source-selection popup
In the merged tab each line is prefixed with the title of the tab it came from.
The merged tab stays live: as the source tabs receive new lines, the merged index is extended and re-sorted automatically. You can pause or stop updates with the usual commands:
:pause   # pause live updates for the merged tab
:resume  # resume live updates
:stop    # stop live updates permanently for the merged tab
Filters, search, marks, and annotations all work the same as on any other tab.
Tail Mode Per Tab
Each tab can independently have tail mode enabled or disabled:
:tail # toggle tail mode for the current tab
When tail is active for a tab, [TAIL] appears in that tab’s log panel title.
MCP Server
logana includes an embedded Model Context Protocol (MCP) server. When enabled, it exposes marked lines and annotations as MCP resources and provides tools so AI assistants can interact with your log analysis session in real time.
Starting the Server
On launch
logana app.log --mcp           # default port 9876
logana app.log --mcp 8080      # custom port
From inside the TUI
:enable-mcp                    # default port 9876
:enable-mcp --port 8080        # custom port
:disable-mcp                   # stop the server
The server listens at http://localhost:<port>/mcp using the Streamable HTTP transport.
Default Port in Config
Set a persistent default port in ~/.config/logana/config.json:
{
  "mcp_port": 9876
}
When both the config and a --port flag are present, the config value takes precedence.
Resources
| URI | Description |
|---|---|
logana://marks | All marked lines — one entry per line formatted as <line_number>: <text> |
logana://annotations | All annotations — each block shows the 1-based line numbers and the comment text |
Resources are updated every render frame so the MCP client always sees the current state of the active tab.
Tools
| Tool | Parameters | Description |
|---|---|---|
toggle_mark | line_index (1-based) | Mark or unmark a log line |
add_annotation | text, line_indices (1-based list) | Attach a comment to one or more lines |
remove_annotation | index (0-based) | Remove an annotation by its position in the list |
Tool calls are applied to the active tab and immediately reflected in the TUI.
Connecting an AI Assistant
Point your MCP client at the server endpoint. For example, to use it with Claude Desktop, add an entry to your claude_desktop_config.json:
{
  "mcpServers": {
    "logana": {
      "url": "http://localhost:9876/mcp"
    }
  }
}
Once connected, the assistant can read your marked lines and annotations and call tools to mark or annotate lines on your behalf.
Commands
CLI Flags
These flags are passed when launching logana from the shell:
| Flag | Description |
|---|---|
<file> | File or directory to open. Omit to read from stdin. |
-f, --filters <path> | Preload a saved filter set (JSON). Filters are applied in a single pass during indexing and remain active for interactive use. |
-i, --include <args> | Add an include filter. Accepts the same arguments as :filter. May be repeated. Examples: -i "error", -i "--field level=ERROR" |
-o, --exclude <args> | Add an exclude filter. Accepts the same arguments as :exclude. May be repeated. Examples: -o "debug", -o "--field level=debug" |
-t, --timestamp <args> | Add a date/time range filter. Accepts the same arguments as :date-filter. May be repeated. |
--tail | Start at the end of the file and enable tail mode. Combined with --filters, the last matching line is available immediately after loading. |
--mcp [PORT] | Start the embedded MCP server on launch. Port defaults to 9876. See MCP Server. |
--headless | Run without TUI — apply filters and write matching lines to stdout or --output. |
--output <path> | Write headless output to a file instead of stdout. Requires --headless. |
In-App Commands
Press : in normal mode to open command mode. Tab completes commands, flags, colors, themes, and file paths. Command history is navigable with Up / Down.
Filtering
| Command | Description |
|---|---|
:filter [--regex|-r] [-l] [--fg COLOR] [--bg COLOR] <pattern> | Add an include filter (show only matching lines) |
:filter --field <key>=<value> | Add a field-scoped include filter (e.g. level=error) |
:exclude [--regex|-r] <pattern> | Add an exclude filter (hide matching lines) |
:exclude --field <key>=<value> | Add a field-scoped exclude filter (e.g. level=debug) |
:date-filter <expr> | Add a date/time range filter |
:set-color [--fg COLOR] [--bg COLOR] | Set highlight color for the selected filter |
:save-filters <file> | Save current filters to a JSON file |
:load-filters <file> | Load filters from a JSON file |
Flag ordering: All options (
--regex,--fg,--bg,-l,--field) must appear before the pattern. Everything after the first pattern word is treated as part of the pattern text.
See Filtering, Date & Time Filters, and Field Filters for full details.
Navigation
| Command | Description |
|---|---|
:<N> | Jump to line N (e.g. :500) |
Files and Tabs
| Command | Description |
|---|---|
:open <path> | Open a file or directory |
:close-tab | Close the current tab |
Display
| Command | Description |
|---|---|
:wrap | Toggle line wrap on/off (persisted across sessions) |
:line-numbers | Toggle the line number gutter on/off (persisted across sessions) |
:tail | Toggle tail mode (auto-scroll on new content) |
:raw | Toggle raw mode — bypass the format parser and show unformatted log lines; title shows [RAW] when active |
:level-colors | Open the level colors dialog — toggle coloring per level (TRACE, DEBUG, INFO, NOTICE, WARNING, ERROR, FATAL); INFO/TRACE/DEBUG/NOTICE are off by default |
:value-colors | Open the value colors dialog — toggle coloring for HTTP methods, status codes, IPs, UUIDs, and process/logger names |
:set-theme <name> | Switch the color theme (persisted across sessions) |
:sidebar-position left|right | Move the filter sidebar to the left or right of the log panel (persisted across sessions) |
OTel Collector
| Command | Description |
|---|---|
:otel [port] | Open an OTLP gRPC receiver tab (default port 4317) |
:otel --http [port] | Open an OTLP HTTP/JSON receiver tab (default port 4318) |
See OTel Collector for full details.
MCP Server
| Command | Description |
|---|---|
:enable-mcp [--port N] | Start the embedded MCP server (default port 9876) |
:disable-mcp | Stop the MCP server |
See MCP Server for full details.
Live Data
These commands control how the current tab handles incoming data from a file watcher or stream (stdin, Docker).
| Command | Description |
|---|---|
:stop | Permanently stop all incoming data for the current tab — drops the file watcher and/or stream |
:pause | Freeze the view; the background watcher/stream keeps running. Title shows [PAUSED] |
:resume | Resume applying incoming data; the latest snapshot is applied immediately |
Note:
:pause/:resumeare non-destructive — no data is lost while paused.:stopis permanent; to resume watching a file after stopping, reopen it with:open.
Structured Fields
| Command | Description |
|---|---|
:fields [col ...] | Set visible columns (e.g. :fields timestamp level message) |
:hide-field <col> | Hide a single column |
:show-field <col> | Show a previously hidden column |
:show-all-fields | Reset to default column display |
:select-fields | Open an interactive column picker |
:show-keys | Show field keys alongside values (e.g. method=GET) |
:hide-keys | Show only values, hiding field keys (default) |
Merged View
| Command | Description |
|---|---|
:merge | Open a source-selection popup, then create a new tab interleaving the selected tabs sorted by timestamp |
See Multi-Tab for full details.
Export and Streaming
| Command | Description |
|---|---|
:export <file> [-t <template>] | Export annotations to a file (default template: markdown) |
:docker | Pick and stream a running Docker container |
:dlt | Pick and stream from a DLT daemon over TCP |
Session
| Command | Description |
|---|---|
:reset | Restore all settings to defaults and clear all persisted state |
Tab Completion
Command mode supports multi-tier tab completion:
- Color names — after
--fgor--bgflags - Template names — after
-t/--templateflags in:export - File paths — for
:open,:save-filters,:load-filters,:export - Theme names — for
:set-theme - Command names — for everything else
Press Tab / Shift+Tab to cycle through completions. A highlighted suggestion appears in the hint area; Space accepts it.
Configuration
logana is configured via a config.json file. The file is entirely optional — all settings have sensible defaults and logana starts normally even if the file is missing. If the file exists but cannot be read or contains invalid JSON or unknown keys, a warning is shown in the notification area on startup.
How the Config File Works
logana never writes to the config file. Any settings defined there are applied on startup and take precedence over the values stored in the database.
Many settings can also be changed at runtime — UI toggles via the UI options menu (u) and display commands (:wrap, :line-numbers, :set-theme, :sidebar-position). When changed at runtime the new value is saved to the database and restored on the next session, unless the setting is also defined in the config file, in which case the config file value always wins.
Schema Validation
logana publishes a JSON Schema for config.json. Add a $schema line to enable validation and autocomplete in VS Code and other JSON-aware editors:
{
  "$schema": "https://raw.githubusercontent.com/pauloremoli/logana/main/schema/config.schema.json",
  "theme": "dracula"
}
VS Code will highlight unknown fields, suggest valid values for enums such as restore_session, and show inline documentation for each option.
Config File Location
The path depends on the operating system:
| OS | Path |
|---|---|
| Linux | ~/.config/logana/config.json |
| macOS | ~/Library/Application Support/logana/config.json |
| Windows | %APPDATA%\logana\config.json |
Full Example
{
  "theme": "dracula",
  "show_mode_bar": true,
  "show_borders": true,
  "show_sidebar": true,
  "show_line_numbers": true,
  "wrap": false,
  "sidebar_side": "right",
  "preview_bytes": 16777216,
  "restore_session": "always",
  "restore_file_context": "always",
  "mcp_port": 9876,
  "dlt_devices": [
    { "name": "my-ecu", "host": "192.168.1.100", "port": 3490 }
  ],
  "keybindings": {
    "navigation": {
      "scroll_down": ["j", "Down"],
      "scroll_up": ["k", "Up"],
      "half_page_down": "Ctrl+d",
      "half_page_up": "Ctrl+u",
      "page_down": "PageDown",
      "page_up": "PageUp"
    },
    "normal": {
      "filter_include": "i",
      "filter_exclude": "o",
      "filter_mode": "f",
      "toggle_filtering": "F",
      "mark_line": "m",
      "toggle_marks_only": "M",
      "visual_mode": "V",
      "enter_ui_mode": "u",
      "show_keybindings": "F1",
      "scroll_left": "h",
      "scroll_right": "l"
    },
    "global": {
      "quit": "q"
    }
  }
}
Top-level Options
| Key | Type | Default | Description |
|---|---|---|---|
theme | string | "github-dark" | Active color theme name (without .json extension) |
show_mode_bar | bool | true | Show the bottom status/mode bar on startup |
show_borders | bool | true | Show panel borders on startup |
show_sidebar | bool | true | Show the filter sidebar on startup |
show_line_numbers | bool | true | Show the line number gutter |
wrap | bool | false | Wrap long lines |
sidebar_side | string | "right" | Pin the filter sidebar to "left" or "right" of the log panel |
preview_bytes | number | 16777216 | Bytes read for the instant preview shown while the full file index is built in the background (16 MiB) |
restore_session | string | "always" | Whether to reopen tabs from the previous session ("always", "ask", "never") |
restore_file_context | string | "always" | Whether to restore per-file state (scroll, marks, search) when reopening a file ("always", "ask", "never") |
mcp_port | number | 9876 | Default port for the embedded MCP server when started via :enable-mcp |
dlt_devices | array | [] | Pre-configured DLT daemon connections; each entry has name, host, and optional port (default 3490) |
Sections
- Keybindings — remapping all keyboard shortcuts
- Themes — built-in themes and creating custom themes
Keybindings
All keybindings are configurable via ~/.config/logana/config.json. Only the keys you want to change need to be specified — all others retain their defaults.
Key Syntax
Each binding is a string (or array of strings for multiple alternatives):
| Syntax | Example | Description |
|---|---|---|
| Single character | "j" | A printable key |
| Modified | "Ctrl+d", "Shift+Tab" | Modifier + key |
| Special keys | "Enter", "Esc", "Space", "Backspace" | Named keys |
| Function keys | "F1", "F12" | Function row keys |
| Navigation keys | "Up", "Down", "Left", "Right", "PageUp", "PageDown", "Home", "End" | Arrow/navigation keys |
Multiple alternatives:
"scroll_down": ["j", "Down"]
Navigation (shared across all modes)
"navigation": {
  "scroll_down": ["j", "Down"],
  "scroll_up": ["k", "Up"],
  "half_page_down": "Ctrl+d",
  "half_page_up": "Ctrl+u",
  "page_down": "PageDown",
  "page_up": "PageUp"
}
Normal Mode
"normal": {
  "filter_include": "i",
  "filter_exclude": "o",
  "open_filter_manager": "f",
  "toggle_filters": "F",
  "search_forward": "/",
  "search_backward": "?",
  "next_match": "n",
  "prev_match": "N",
  "mark_line": "m",
  "toggle_marks_view": "M",
  "enter_visual_mode": "V",
  "visual_char": "v",
  "yank_marked": "Y",
  "open_ui_options": "u",
  "show_keybindings": "F1",
  "open_command_mode": ":",
  "scroll_left": ["h", "Left"],
  "scroll_right": ["l", "Right"],
  "start_of_line": "0",
  "end_of_line": "$",
  "goto_first_line": "g",
  "goto_last_line": "G",
  "toggle_status_bar": "b",
  "toggle_borders": "B",
  "edit_comment": "r",
  "delete_comment": "d",
  "comment_line": "c",
  "next_error": "e",
  "prev_error": "E",
  "next_warning": "w",
  "prev_warning": "W",
  "clear_all": "C"
}
Global (always active)
"global": {
  "quit": "q",
  "next_tab": "Tab",
  "prev_tab": "Shift+Tab",
  "new_tab": "Ctrl+t",
  "close_tab": "Ctrl+w"
}
Filter Manager
"filter": {
  "toggle": "Space",
  "edit": "e",
  "delete": "d",
  "set_color": "c",
  "add_date_filter": "t",
  "move_down": "J",
  "move_up": "K",
  "toggle_all": "A",
  "clear_all": "C"
}
Visual Line Mode
"visual_line": {
  "comment": "c",
  "mark": "m",
  "yank": "y",
  "filter_include": "i",
  "filter_exclude": "o",
  "search": "/"
}
Visual Char Mode
"visual": {
  "move_left": ["h", "Left"],
  "move_right": ["l", "Right"],
  "word_forward": "w",
  "word_backward": "b",
  "word_end": "e",
  "word_forward_big": "W",
  "word_backward_big": "B",
  "word_end_big": "E",
  "start_of_line": "0",
  "first_nonblank": "^",
  "end_of_line": "$",
  "find_forward": "f",
  "find_backward": "F",
  "till_forward": "t",
  "till_backward": "T",
  "repeat_motion": ";",
  "repeat_motion_rev": ",",
  "start_selection": "v",
  "filter_include": "i",
  "filter_exclude": "o",
  "search": "/",
  "yank": "y",
  "exit": "Esc"
}
Comment (Annotation) Mode
"comment": {
  "newline": "Enter",
  "save": "Ctrl+s",
  "cancel": "Esc",
  "delete": "Ctrl+d"
}
Confirm Dialogs
"confirm": {
  "yes": "y",
  "no": "n"
}
UI Options Mode
"ui": {
  "toggle_sidebar": "s",
  "toggle_status_bar": "b",
  "toggle_borders": "B"
}
Select Fields Mode
"select_fields": {
  "toggle": "Space",
  "move_down": "J",
  "move_up": "K",
  "enable_all": "a",
  "disable_all": "n",
  "apply": "Enter"
}
Docker Select Mode
"docker_select": {
  "confirm": "Enter"
}
Keybindings Help
"help": {
  "close": ["Esc", "q", "F1"]
}
Conflict Validation
At startup, logana validates all configured keybindings for conflicts within each mode scope. Conflicts are printed to stderr with a description of the overlapping bindings, but do not prevent startup.
Themes
logana ships with 22 bundled themes and supports fully custom themes via JSON files.
Switching Themes
:set-theme catppuccin-mocha
Tab completes theme names. The chosen theme is persisted to the database and restored on the next session.
To pin a theme permanently (overriding any runtime changes), add it to ~/.config/logana/config.json:
{ "theme": "catppuccin-mocha" }
Bundled Themes
Dark
| Name | Description |
|---|---|
atomic | Vibrant, high-saturation |
catppuccin-macchiato | Pastel purple, slightly lighter than mocha |
catppuccin-mocha | Pastel purple, the most popular Catppuccin variant |
dracula | Purple, default theme |
everforest-dark | Earthy green, easy on the eyes |
github-dark | GitHub dark — deep navy with blue accents |
github-dark-dimmed | GitHub dark dimmed — softer navy variant |
gruvbox-dark | Warm retro browns and yellows |
jandedobbeleer | Colorful, high contrast |
kanagawa | Japanese ink — deep blues and warm golds |
monokai | Classic dark with vivid accents |
nord | Cool blue-grey Arctic palette |
onedark | Atom-inspired, muted cool colors |
paradox | High contrast |
rose-pine | Muted roses and purples |
solarized | Classic muted palette |
tokyonight | Deep blue, inspired by Tokyo at night |
Light
| Name | Description |
|---|---|
catppuccin-latte | Pastel, warm cream background |
everforest-light | Earthy green, warm paper background |
github-light | GitHub light — clean white with blue accents |
onelight | Atom-inspired, clean white background |
rose-pine-dawn | Warm rose tones on a parchment background |
Custom Themes
Place .json files in ~/.config/logana/themes/. A user theme with the same name as a bundled one takes priority.
Minimal example
Only five fields are required — everything else falls back to built-in defaults:
{
  "root_bg":    "#1e1e2e",
  "border":     "#6272a4",
  "border_title": "#f8f8f2",
  "text":       "#f8f8f2",
  "error_fg":   "#ff5555",
  "warning_fg": "#f1fa8c",
  "process_colors": ["#ff5555", "#50fa7b", "#ffb86c", "#bd93f9", "#ff79c6", "#8be9fd"]
}
Full example (Dracula)
{
  "root_bg":          "#282a36",
  "border":           "#6272a4",
  "cursor_bg":        "#6272a4",
  "border_title":     "#f8f8f2",
  "text":             "#f8f8f2",
  "text_highlight_fg": "#ffb86c",
  "text_highlight_bg": "#7a4a10",
  "cursor_fg":        "#1c1c1c",
  "trace_fg":         "#6272a4",
  "debug_fg":         "#8be9fd",
  "notice_fg":        "#f8f8f2",
  "warning_fg":       "#f1fa8c",
  "error_fg":         "#ff5555",
  "fatal_fg":         "#ff5555",
  "search_fg":        "#1c1c1c",
  "visual_select_bg": "#44475a",
  "visual_select_fg": "#f8f8f2",
  "mark_bg":          "#463c0f",
  "mark_fg":          "#f8f8f2",
  "process_colors":   ["#ff5555", "#50fa7b", "#ffb86c", "#bd93f9", "#ff79c6", "#8be9fd"],
  "value_colors": {
    "http_get":    "#50fa7b",
    "http_post":   "#8be9fd",
    "http_put":    "#ffb86c",
    "http_delete": "#ff5555",
    "http_patch":  "#bd93f9",
    "http_other":  "#6272a4",
    "status_2xx":  "#50fa7b",
    "status_3xx":  "#8be9fd",
    "status_4xx":  "#ffb86c",
    "status_5xx":  "#ff5555",
    "ip_address":  "#bd93f9",
    "uuid":        "#6c71c4"
  }
}
Color Formats
All color values accept:
- Hex string:
"#RRGGBB" - RGB array:
[r, g, b](each 0–255)
Fields Reference
Required
| Field | Used for |
|---|---|
root_bg | Main background |
border | Panel border lines and dimmed decorator text |
border_title | Panel title text |
text | Default log line text |
error_fg | ERROR level lines |
warning_fg | WARN/WARNING level lines |
process_colors | Array of colors cycled across process/logger name columns (can be toggled via :value-colors) |
Optional (with defaults)
| Field | Default | Used for |
|---|---|---|
cursor_bg | = border | Background of the cursor line, command bar, and search bar |
text_highlight_fg | #ffb86c | Search match background; also the cursor for the current match |
text_highlight_bg | #7a4a10 | Background behind search highlight |
cursor_fg | #1c1c1c | Text color on the cursor line (sits on cursor_bg) |
trace_fg | #6272a4 | TRACE level lines |
debug_fg | #8be9fd | DEBUG level lines |
info_fg | = text | INFO level lines (disabled by default; enable via :level-colors) |
notice_fg | #f8f8f2 | NOTICE level lines |
fatal_fg | #ff5555 | FATAL/CRITICAL level lines |
search_fg | #1c1c1c | Foreground of search match highlights |
visual_select_bg | #44475a | Visual line selection background |
visual_select_fg | #f8f8f2 | Visual line selection foreground |
mark_bg | #463c0f | Marked line background |
mark_fg | #f8f8f2 | Marked line foreground |
value_colors | see below | Per-token HTTP/IP/UUID colors |
value_colors sub-object
All fields are optional and fall back to Dracula-palette defaults.
| Field | Default | Token type |
|---|---|---|
http_get | #50fa7b | GET |
http_post | #8be9fd | POST |
http_put | #ffb86c | PUT |
http_delete | #ff5555 | DELETE |
http_patch | #bd93f9 | PATCH |
http_other | #6272a4 | HEAD, OPTIONS, and others |
status_2xx | #50fa7b | 2xx success codes |
status_3xx | #8be9fd | 3xx redirect codes |
status_4xx | #ffb86c | 4xx client error codes |
status_5xx | #ff5555 | 5xx server error codes |
ip_address | #bd93f9 | IPv4 and IPv6 addresses |
uuid | #6c71c4 | UUID strings |
Toggling token and level colors at runtime
Use :value-colors to open an interactive dialog where you can enable or disable individual token types — including Process / logger colors — without editing the theme file.
Use :level-colors to open a similar dialog for log levels. Each level (TRACE, DEBUG, NOTICE, WARNING, ERROR, FATAL) can be toggled independently. The choices are saved per-file across sessions.
Tips for Light Themes
Set cursor_bg to a color that is noticeably darker than root_bg so the cursor line and command bar are clearly visible. Keep border as a subtle separator — it can be close to root_bg if you prefer minimal panel borders.
Set cursor_fg and search_fg to a dark color — they appear as text on the cursor_bg background and must contrast against it.
{
  "root_bg":   "#fafafa",
  "border":    "#d0d0d0",
  "cursor_bg": "#aaaaaa",
  "cursor_fg": "#383a42",
  "search_fg": "#383a42"
}
Log Formats
logana detects the log format automatically by sampling the first lines of the file. No flags or configuration are required.
Supported Formats
| Format | Examples |
|---|---|
| OpenTelemetry (OTLP) | OTLP/JSON protobuf-JSON encoding, OTel SDK JSON |
| DLT | AUTOSAR binary (storage, wire, simplified) and dlt-convert -a text |
| JSON | tracing-subscriber JSON, bunyan, pino, any structured JSON logger |
| Syslog | RFC 3164 (BSD), RFC 5424 |
| Journalctl | short, short-iso, short-precise, short-full, short-monotonic, short-unix, json-sse, json-seq |
| Common / Combined Log | Apache access, nginx access |
| Logfmt | Go slog, Heroku, Grafana Loki |
| Common log family | env_logger, tracing-subscriber fmt (with/without spans), logback, log4j2, Spring Boot, Python logging, loguru, structlog |
Detection
All registered parsers score a confidence value against the first 200 lines of the file. The parser with the highest score above 0.0 is selected. More specific parsers naturally score higher on their format; the common log parser applies a 0.95× penalty to yield to more specific parsers on ties. The OTLP parser scores up to 1.5 (above the 1.0 maximum for plain JSON) so it wins when OpenTelemetry fields are present.
The detected format name is shown in the status bar.
Format Details
DLT (AUTOSAR Diagnostic Log and Trace)
Three binary layouts are supported and converted to text at load time:
- Storage format — standard AUTOSAR DLT files with 16-byte storage headers (magic bytes
DLT\x01) - Wire format — concatenated DLT messages without storage headers, as received from a
dlt-daemonTCP connection - Simplified format — compact
DLT\x01+ ECU + APID + CTID + timestamp + payload
The text output produced by dlt-convert -a is also parsed directly.
Fields extracted: timestamp, hw_ts (hardware timestamp), mcnt (message counter), ecu, apid (application ID), ctid (context ID), type, subtype, mode (verbose/non-verbose).
Verbose payloads are decoded (strings, integers, floats, booleans, raw data). Non-verbose payloads are shown as hex.
OpenTelemetry (OTLP)
Two JSON-based OTel log formats are supported for file-based parsing. logana also accepts live OTLP streams over gRPC (:otel, port 4317) and HTTP/JSON (:otel --http, port 4318) — see OTel Collector.
OTLP/JSON (protobuf-JSON encoding — exported by collectors):
{"timeUnixNano":"1700000000000000000","severityNumber":9,"severityText":"INFO","body":{"stringValue":"request received"},"attributes":[{"key":"service.name","value":{"stringValue":"my-svc"}}]}
- Timestamp:
timeUnixNano(nanosecond epoch string) - Severity:
severityNumber(1–4=TRACE, 5–8=DEBUG, 9–12=INFO, 13–16=WARN, 17–20=ERROR, 21–24=FATAL) and/orseverityText - Body:
body.stringValue(AnyValue object encoding) - Attributes: array of
{key, value}objects
OTel SDK JSON (emitted directly by SDKs):
{"timestamp":"2024-01-01T00:00:00.000Z","severity_text":"INFO","severity_number":9,"body":"request received","attributes":{"service.name":"my-svc"}}
- Timestamp:
timestamp(ISO 8601) - Severity:
severity_textand/orseverity_number - Body: direct string value
- Attributes: flat
{key: value}dict
Both formats surface service.name, code.namespace, logger, and similar target attributes as the target column.
JSON
Structured JSON logs, one JSON object per line. Supports:
- tracing-subscriber JSON —
{"timestamp":...,"level":...,"target":...,"span":{...},"fields":{"message":...}} - bunyan —
{"time":...,"level":...,"name":...,"msg":...} - pino —
{"time":...,"level":...,"msg":...} - Any structured JSON log with recognizable timestamp/level/message keys
Span sub-fields (e.g. span.name, span.id, fields.request_id) are discoverable and selectable as columns.
Syslog
- RFC 3164 (BSD):
<PRI>Mmm DD HH:MM:SS hostname app[pid]: message - RFC 5424:
<PRI>VER TIMESTAMP HOSTNAME APP PROCID MSGID [SD] MSG
Priority is decoded to a log level; facility is exposed as an extra field.
Journalctl
Text output from journalctl in several formats:
- short:
Mmm DD HH:MM:SS hostname unit[pid]: message - short-iso:
YYYY-MM-DDTHH:MM:SS±ZZZZ hostname unit[pid]: message - short-precise:
Mmm DD HH:MM:SS.FFFFFF hostname unit[pid]: message - short-full:
Www YYYY-MM-DD HH:MM:SS TZ hostname unit[pid]: message - short-monotonic:
[SSSSS.FFFFFF] hostname unit[pid]: message - short-unix:
[EPOCH.FFFFFF] hostname unit[pid]: message - json-sse: server-sent events wrapping JSON journal entries (
data: {...}) - json-seq: RFC 7464 JSON sequence (
\x1e{...}\n)
Header/footer lines (-- Journal begins..., -- No entries --) are silently skipped.
Common / Combined Log Format
Apache and nginx access logs:
- CLF:
host ident authuser [dd/Mmm/yyyy:HH:MM:SS ±ZZZZ] "request" status bytes - Combined: CLF +
"referer" "user-agent"
Fields with value - are omitted.
Logfmt
Space-separated key=value pairs. Used by Go slog, Heroku, Grafana Loki, and many 12-factor apps. Quoted values (key="value with spaces") are supported.
Requires at least 3 key=value pairs per line to distinguish from plain text.
Common Log Family
A broad family sharing the TIMESTAMP LEVEL TARGET MESSAGE structure, with several sub-strategies:
- env_logger:
[ISO LEVEL target] msgor[LEVEL target] msg - logback / log4j2:
DATETIME [thread] LEVEL target - msg - Spring Boot:
DATETIME LEVEL PID --- [thread] target : msg - Python basic:
LEVEL:target:msg - Python prod:
DATETIME - target - LEVEL - msg - loguru:
DATETIME | LEVEL | location - msg - structlog:
DATETIME [level] msg key=val... - tracing-subscriber fmt with spans:
TIMESTAMP LEVEL span_name{k=v ...}: target: msg— span context is parsed and available as thespancolumn - Generic fallback:
TIMESTAMP LEVEL rest-as-message— any timestamp + level keyword combination
tracing-subscriber fmt (Rust / Axum)
Rust applications using tracing-subscriber’s default fmt output produce lines like:
Startup (no span):
2024-02-21T10:00:00.123456Z INFO app::server: listening on 0.0.0.0:3000
Runtime (with span):
2024-02-21T10:00:01.234Z INFO request{method=GET uri=/api/users id="0.5"}: app::handler: processing request
Both forms are handled: span lines are parsed into a span column with name and fields; non-span lines fall through to the generic fallback.
Data Locations
Runtime Files
Paths depend on the operating system:
| Location | Linux | macOS | Windows |
|---|---|---|---|
| Database | ~/.local/share/logana/logana.db | ~/Library/Application Support/logana/logana.db | %APPDATA%\logana\logana.db |
| Config file | ~/.config/logana/config.json | ~/Library/Application Support/logana/config.json | %APPDATA%\logana\config.json |
| Themes dir | ~/.config/logana/themes/ | ~/Library/Application Support/logana/themes/ | %APPDATA%\logana\themes\ |
| Templates dir | ~/.config/logana/templates/ | ~/Library/Application Support/logana/templates/ | %APPDATA%\logana\templates\ |
Database
The SQLite database stores:
- Filters — include/exclude patterns and date filters, per source file
- File context — per-file session state: scroll position, search query, wrap, sidebar visibility, marked lines, field layout, show-keys preference, and more
- Session tabs — the ordered list of files/Docker streams open when logana last exited (used for session restore)
The database is created automatically on first run. Schema migrations run on startup — no manual setup needed.
Config File
The config file is optional. If it is absent, logana starts with all defaults. If the file exists but cannot be read, contains invalid JSON, or has unknown keys, a warning is shown in the notification area on startup. Partial configs are valid — only specified keys override defaults.
See Configuration for the full schema.
Custom Themes
Place .json files in ~/.config/logana/themes/. Files here shadow bundled themes of the same name. See Themes for the theme JSON format.
Custom Export Templates
Place .txt template files in ~/.config/logana/templates/. Files here shadow bundled templates (markdown, jira) of the same name. See Annotations & Export for the template format.